The case for investing versus cash
Why cash isn’t always the safe option
It’s easy to see why cash feels safe. Its value doesn’t rise and fall in nominal terms, and your money is readily available when you need it. However, holding cash comes with a risk of its own: inflation. If prices rise faster than your savings, your spending power can fall over time.
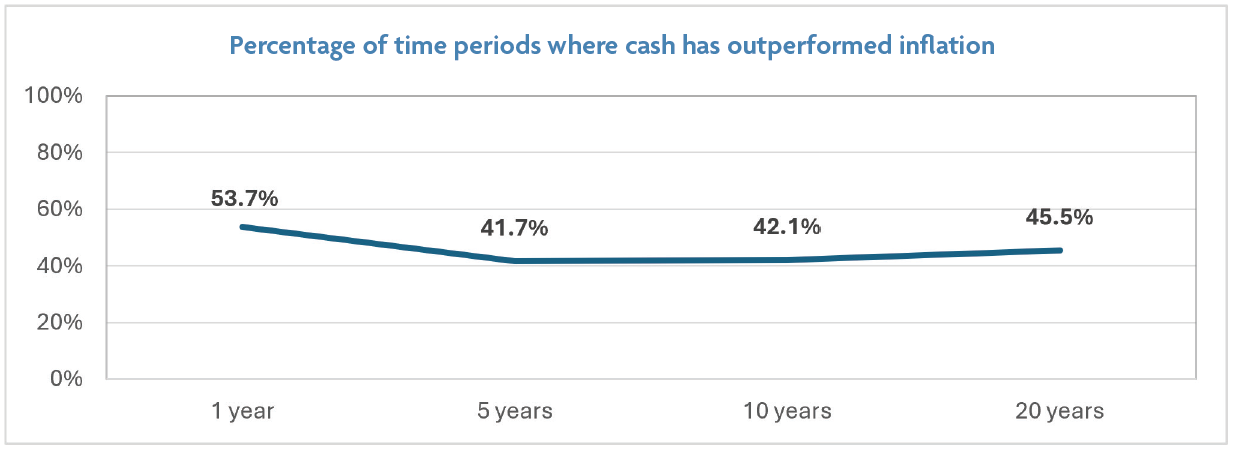
The chart below shows that cash has beaten inflation little more than half the time over one-year periods and less than half the time over five, ten and twenty-year periods. That means investors who remained in cash often saw the purchasing power of their savings decline over time. For investors with longer time horizons, the greater risk may not be short-term market volatility, but failing to generate returns that keep pace with the rising cost of living.
Investing for real returns
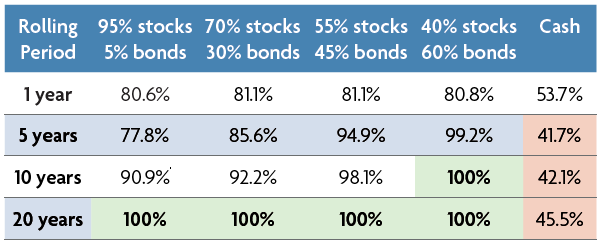
Historically, diversified investment portfolios have been more likely to deliver returns above inflation than cash, particularly over longer time periods. The table shows how often portfolios with different levels of investment risk have outpaced inflation over rolling one, five, ten and twenty-year periods. The portfolios range from a higher-risk allocation of 95% equities and 5% bonds to a lower-risk allocation of 40% equities and 60% bonds.
While past performance is not a reliable guide to future returns, history suggests that investors who remain invested in diversified portfolios have generally improved their chances of growing their wealth and preserving their purchasing power over the long term.
Download this investment perspective (pdf)